|
Month |
Long-Term Project
Schedule |
|
Sept |
Present introductory lesson water,
ecosystems and human impact. Learn to take temperature and pH
readings.Prepare tanks for experiment. |
|
Oct |
Begin tule experiment.Student teams take
daily pH and temperature readings of the tanks and record findings
on data sheets.
|
|
Nov |
Student teams take daily pH and
temperature readings of the tanks until project is finished and
record findings on data sheets.Students each graph class results and
discuss. |
|
Dec |
Complete any remaining charts and graphs,
if needed. |
|
Jan |
Tule experiment is repeated.Student teams
take daily pH and temperature readings of the tanks and record
findings on data sheets. |
|
Feb |
Fieldtrip to Tule Ponds. Student teams
take daily pH and temperature readings of the tanks until project is
finished and record findings on data sheets.Students each graph
class results and discuss. |
|
Mar |
Students prepare class presentation using
data and observations from both rounds of the experiment and the
fieldtrip to Tule Ponds. |
|
VOCABULARY: pH MATERIALS: Three fish tanks (10-gallon) or 3 (1800 ml or
larger beakers)
Wetlands are ecosystems where the land is inundated
or saturated with water. Wetlands were once destroyed because they were
perceived as worthless land and their ecological value was not understood.
Half of the wetland acreage existing in 1770 in the contiguous United
States had been destroyed by 1970. We have since learned that wetland
areas are very valuable, providing flood protection, water quality
improvement, erosion control and habitats for thousands of species of
plants and animals. Wetlands can remove pollutants in a variety of
ways. Some pollutants in water runoff that are toxic to humans may be
taken up by the aquatic plants, bacteria and protozoa of the wetlands as
part of their normal photosynthetic or respiration processes. Other
pollutants, like heavy metals, can bind to clay particles that are common
components of soils and sink to the bottom. These processes result in
cleaner, healthier water in the wetland and for downstream areas. Although there are now restrictions on filling in or polluting wetlands throughout the United States, pollutants from surrounding areas threaten the health of some wetlands. Sometimes wetlands are polluted by a single source, such as industrial or municipal waste (“point source pollution”). Sometimes they are polluted from a multitude of sources (“non-point pollution”), such as car emissions or motor oil, that eventually wash into the wetlands and accumulate over time to toxic levels. Whatever the source, too much pollution can cause significant damage. Our watersheds reflect the health of our environment. Taking pH readings is a quick and inexpensive way of determining the health of a body of water. The fifth grade has two projects and a final
presentation. The first project is a long-term experiment at school and
the second is a one-day field trip to take readings at a wetlands research
area. PROJECT ONE involves long-term pH monitoring of
tanks “polluted” by acids and bases. Students will test to see if tule
plants help to correct the pH in the tanks over time. This experiment will
be repeated during the school year so students can validate their results.
The experiment should take place once before Winter Break and once after
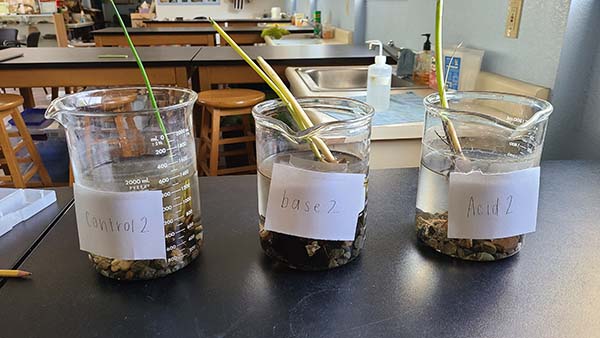
Winter Break. 1. TANK PREPARATION – The Project One experiment
will need three 10-gallon tanks and two smaller tanks or beakers (2- to 5-gallons
or 1800 ml glass beakers). Tule plugs (tule and a mass of their underwater
roots) of similar sizes will be added to the large tanks. Each will be
filled with tap water and placed in a sunny area or one with natural
lighting. One tank will be polluted with vinegar to a pH of approximately
5 and one tank will be polluted with ammonia to a pH of 10. The third tank
with tule should be left with only tap water and will be the control. The two smaller tanks should be filled with tap
water and similarly polluted, one with vinegar to a pH of approximately 5
and one with ammonia to a pH of 10. The polluted tanks without tule help
to determine whether any pH changes are due to tule rather than exposure
to air or other factors. As you pollute the tanks, be sure to stir them and
then let them rest for a while and add more pollutant until you get the
desired pH. If you add too much pollutant (i.e., it is below 5 or above
10), just take out some polluted water and add tap water until you reach
the desired pH. 2. STUDENT GROUPS – Students should be divided into
groups of three to take daily readings. Each day, one team will be
responsible for readings and observations. Team members take turns using
the thermometer, taking pH readings and filling in the lab sheet.
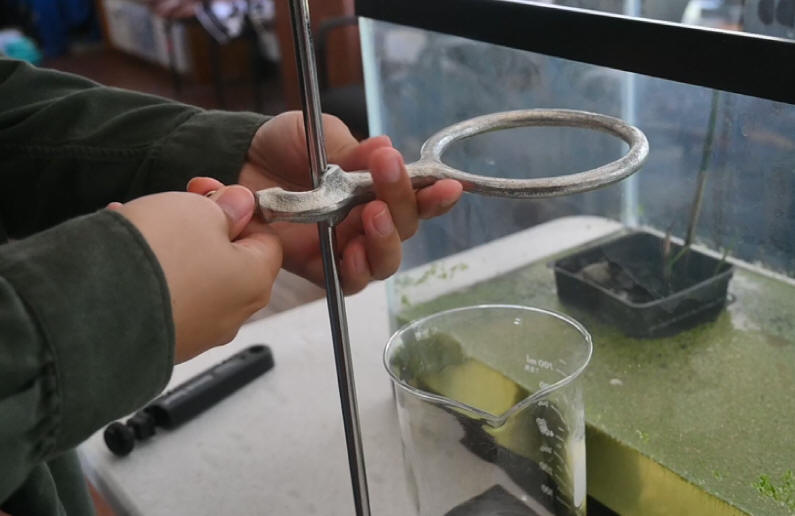
3. TAKING TEMPERATURE READINGS – The thermometer
should be held with the lower part of the thermometer in the water for 30
seconds. Students can count or look at a clock for the timing. Repeat for
all the tanks and enter temperature on the data sheet. 4. TAKING pH READINGS – Use instructions provided
to know how to use the pH meter. Repeat for all the tanks and enter pH on
the data sheet. 5. OBSERVATIONS – Students should be instructed to
write down any observations they note when looking at the various tanks.
Does one look different? If so, how? Do they smell the same, etc.?
Qualitative observations are an important part of the experiment. All data
and observations should be entered in the class data sheet next to the
tanks.
It is highly recommended to take daily or weekly
photos of the tanks to support the final presentation. 6. READINGS AND OBSERVATIONS should be taken daily
for 6 to 8 weeks. If after 6 weeks the pH of all the tanks with tule has
equalized and the tanks look about the same, you can end the experiment.
If not, continue the experiment for another few weeks.
7. GRAPHING – Students should each graph the
results using the graph template and following the example provided. The
dates will need to be filled in. If you did not take readings due to
holidays or weekends, just leave those days blank. 8. REVIEW RESULTS – Students should review their
results and graphs and look for patterns. Did the tanks equalize in pH?
Did the tanks without tule equalize at the same rate? Based on results, do
students think tule made a difference? How did any other organisms in the
water do? Is the water in each tank clear? Were there changes in clarity
during the experiment? 9. REPEAT THE EXPERIMENT – The experiment should be
repeated with fresh water and tule. It should be explained to students
that we repeat experiments to validate the results and make sure there
wasn’t an error the first time. PROJECT TWO is a field trip to Tule Ponds to
observe living wetlands and the plants, animals and soil of wetlands in
their natural setting. They take temperature and pH readings of water in
the various ponds and enter the data in data booklets. They then compare
readings with historical data to determine the current health of the water
in the various ponds. PRESENTATION – After repeating the experimental
project twice and completing the visit to Tule Ponds, students should
prepare a summary PowerPoint presentation of their findings for both
projects. How did the project experiment help them understand what is
happening at Tule Ponds? How do the docent lessons help their
understanding? |