BACKGROUND:
Physicians measure the human body to check the status
of its health. They test hormone levels, size of the fetus (for
pregnant women), weight, and many other parts to see if anything is going
wrong with the body.
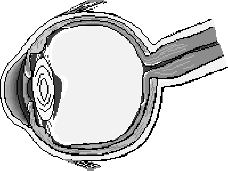
An optometrist and ophthalmologist are two types of people who determine the
health of your eyes. Optometry is the measurement and science of
vision care. Optometrists do not treat diseases of the eye, practice
medicine, or perform surgery. Ophthalmology is the study of the
diseases of the eye. An ophthalmologist or oculist is a physician who
can detect and correct eye problems. Detecting problems of the eye can
start with a simple test to see if a person's eyesight is normal. The
test requires an understanding and interpretation of measurement.
This lab gathers data on the eyesight of your students. It may also
help alert parents to their child's need for glasses. In this
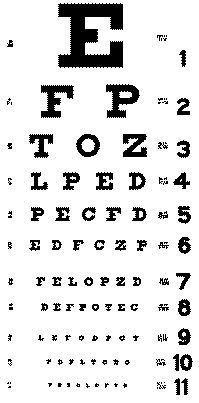
activity, students will measure their vision by using a simple Snellen Chart
which quickly teìls if a person's eyesight is normal. The chart uses
letters like P, S, E, Z, and L that help determine if your eyes are
impaired. The eye chart was developed by a Dutch physician, Herman
Snellen, in 1863. It is designed to be viewed at 6 meters or 20 feet
and the patient is asked to read off letters and numbers that get
successively smaller with each line read. In the United States, we use
the English system to read the chart. However, it was originally invented
and is still used in most countries in the metric system. Perfect
eyesight in a metric country is 6/6 and in the English system, 20/20.
The vision score is expressed as a fraction determined by the last line read
successfully. A score of 20/30 for example, means that from 20 feet
away, you can read a line that people with normal vision can make out at 30
feet. When the second number is larger, it means your vision is not as
sharp as the norm. A score of 20/10 on the other hand, means that at
20 feet you can read letters that a person with normal vision will have to
move up to 10 feet to see clearly. However, when an optometrist or
ophthalmologist prescribes new glasses, it is written in the metric system
related to the diameter of the lenses.
Variations of the Snellen eye chart are used to test distance vision, first
without glasses and later with an assembly of lenses made to correspond to
the new prescription.
Astigmatism causes a blurred vision where lines seem to merge. Without
astigmatism, it is difficult to see the same thing a person with an
astigmatism does.
PROCEDURE:
- Hang several eye
charts around the room (in module) and have groups of students test each
other. They should record their right eye, left eye, and both eyes.
Use a piece of paper to cover one eye. Students should record the
information on their lab sheet. If students find they have trouble
reading the chart, assure them that having glasses are only a means to
see better. Mention all the great people in history who have
worn glasses from Marie Curie, Einstein, and Ben Franklin to most of our
presidents.
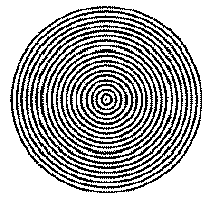
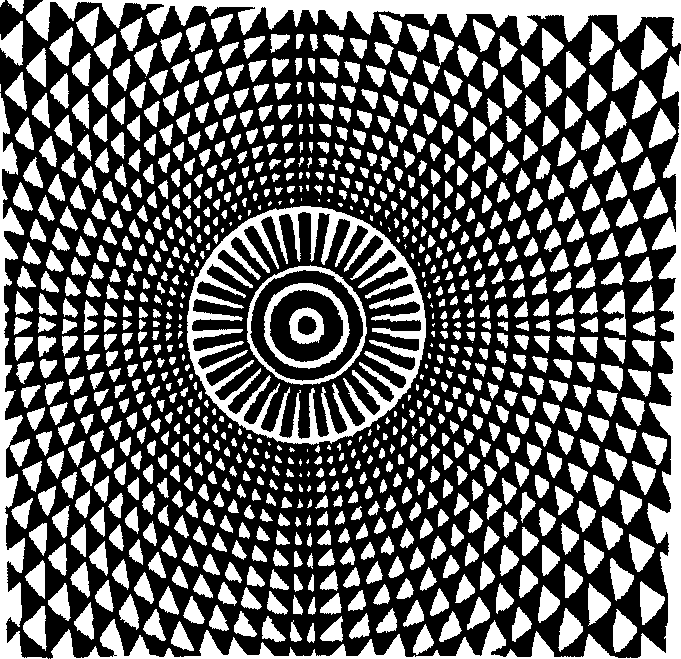
- Use the chart for astigmatism.
There are several examples of these charts on the enclosed sheet.
Instruct students to look at the chart at their normal reading distance.
Look at the illustrations first with one eye closed then the other.
If some sections of the image look blacker or sharper than others, the
student may have an irregularity in the curvature of the lens called astigmatism
.
ASTIGMATISM
|