| Month | Long-Term Project Schedule |
| Sept | Learn to use a thermometer and observe weather conditions. Start recording regular weather observations at the same time of day. Present introduction lesson. |
| Oct | Record weather observations at the same time of day. Plot information on graph Docent Lesson |
| Nov | Record weekly temperature and weather observations at the same time of day. Start graphing the data collected so students can see the transition from fall to winter. Docent Lesson |
| Dec | Record weekly temperature and weather observations at the same time of day and day of week. Docent Lesson |
| Jan | Record weekly temperature and weather observations at the same time of day. Docent Lesson |
| Feb | Record weekly temperature and weather observations at the same time of day. Docent Lesson |
| Mar | Learning the elements of weather and water cycle |
|
OBJECTIVES: 1.Collect
temperature and weather observation on a weekly basis.
meteorologist
Temperature helps explain changing weather on a
rotating Earth. This is just an introduction to collect data and plot the
information to see if temperature causes weather changes. Students will
learn that the weather we experience is due to many factors. Weather
depends partly on how close we are to land, water, and mountains, but it
also depends on how the Earth rotates through space. Water from the oceans
interacts with the atmosphere in a way that influences our weather as
well. Movement of the atmosphere throughout the world helps explain
weather patterns that we see. Weather changes all the time. Weather is created
in the atmosphere that envelops the Earth. Weather changes so much because
the Earth is constantly spinning. Lands and water bodies heat up
differently and that difference causes constant atmospheric change. Also
note that "seasons" are not the same as weather. Seasons have to do with
the angle of the solar radiation we receive caused by the tilt of the
Earth's axis.
The focus of this long-term experiment is for
students to act as scientists by collecting temperature and other weather
data and plotting a class graph with the results. They will see how the
class graph is useful for observing changes over time. This project will
prepare students for the 1st
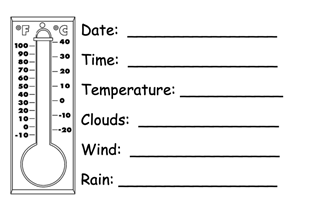
grade project, which focuses on light and seasons. PROCEDURE: DATA SHEETS – Fill in one data
sheet per week. Have students take turns filling in the data sheets with
teacher assistance or have each child do one and put in there own personal
data “pocket.”.
TEMPERATURE – Place the class thermometer outside
in the shade before taking the temperature. The thermometer should be
vertical. Students take the temperature in the same place and at the same
time of day for each measurement. Measurements should be taken at least
once a week from September 15 to March 31. Use the Fahrenheit side (°F)
since that scale is what is most commonly used for weather in the United
States or if you want use Centigrade. Students will need help understanding the numbers.
Teachers should have students try to identify the numbers where the red
line ends on the thermometer. As they get more used to measuring
temperature (focus of the first docent lesson) and learning their numbers,
they will be able to read the numbers on their own. CLOUDS – Students should look at the sky and see
if there are clouds and what type they look like. They should mark the
appropriate box. They will learn the cloud type names in the second
lesson, but until then they can look at the pictures. RAIN – Students should mark if there is no rain, a
little rain or a lot of rain.
|