|
|
Applied Science - Science and Math
(4B)
|
|
|
|
|
Applied Science - Science and Math
(4B)
|
|
|
Measure the height of each flagpole. Record the height below each flag pole.
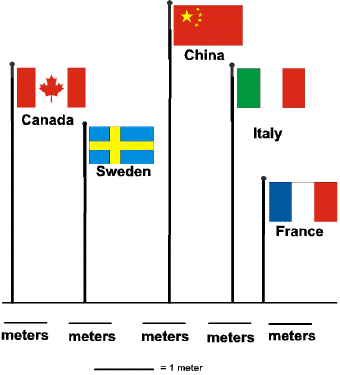
Write the names of the countries on the bottom lines. Draw bars showing the height of the flag poles of each country. Color each bar a different color. See the example.
How does a bar graph help you to look at data.